
It is the first Monday of the month, and the management meeting opens with the dashboard. Revenue, margin, headcount, open orders. One region is clearly below plan. Someone asks why, and nobody in the room can say.
The meeting ends with an action item: “BI to look into it.”
Most organisations will recognise the scene. The dashboard shows the shortfall correctly. Explaining it would mean combining data the dashboard was never built to combine.
Our view is that the classic dashboard has had its day. That includes the self-service kind in Power BI or Tableau. Today an AI connected to your analytics database can build the view you need at the moment you ask, and an AI agent can deliver the answer to your inbox or chat before you think to ask.
This article explains why dashboards lag behind decisions, what replaces them, and the three steps that have to come first. It closes with how the European Space Agency applied the same order in a very different setting.
Why dashboards look backwards
A typical management dashboard is built around a set of KPIs agreed once, often years ago. The data comes from several systems: sales figures from the CRM, costs and orders from the ERP, staff data from HR, operational numbers from core systems. These are combined in batches, usually overnight or at month end, and each system has its own idea of what a customer, an order or a region is.
That set-up is good at describing the past in a fixed format. It struggles with anything outside that format, such as a new breakdown, a comparison nobody planned for or a look at what is likely to happen next quarter.
The queue behind every new question
When the dashboard cannot answer a question, the question goes to the BI or controlling team. Someone has to find the right tables, reconcile the definitions, build the query and check the result. The team is usually small and the request list long, so a simple follow-up can take a week and a new report can take a month.
The price decision or the budget shift is made in the meantime, with the information at hand. When the analysis finally arrives, it explains a decision that has already been taken.
What slow answers cost
Slow answers are the obvious cost. People also find ways around them: departments build their own spreadsheets from exports, and soon the sales figure in the board deck differs from the one in the controlling report. Meetings then spend their time debating which number is right. Trust in the data drops, and with it the willingness to wait for the next analysis.
Data specialists pay a price too. Much of their week goes into extracting, cleaning and reconciling data for one-off requests, which leaves little time for forecasting or for the models that would help the business look ahead.
Why classic dashboards have had their day
Self-service BI was meant to fix the queue. Business users would build their own reports, and the BI team would stop being a bottleneck. In many organisations it turned out differently. Building a useful report still means knowing the data model, the filters and the definitions, so most people open the finished dashboards and send everything else to BI, as before.
The deeper problem is the format. Every dashboard is a guess, made in advance, about which questions people will ask. The guess was made months ago, and the question in Monday’s meeting was not on the list.
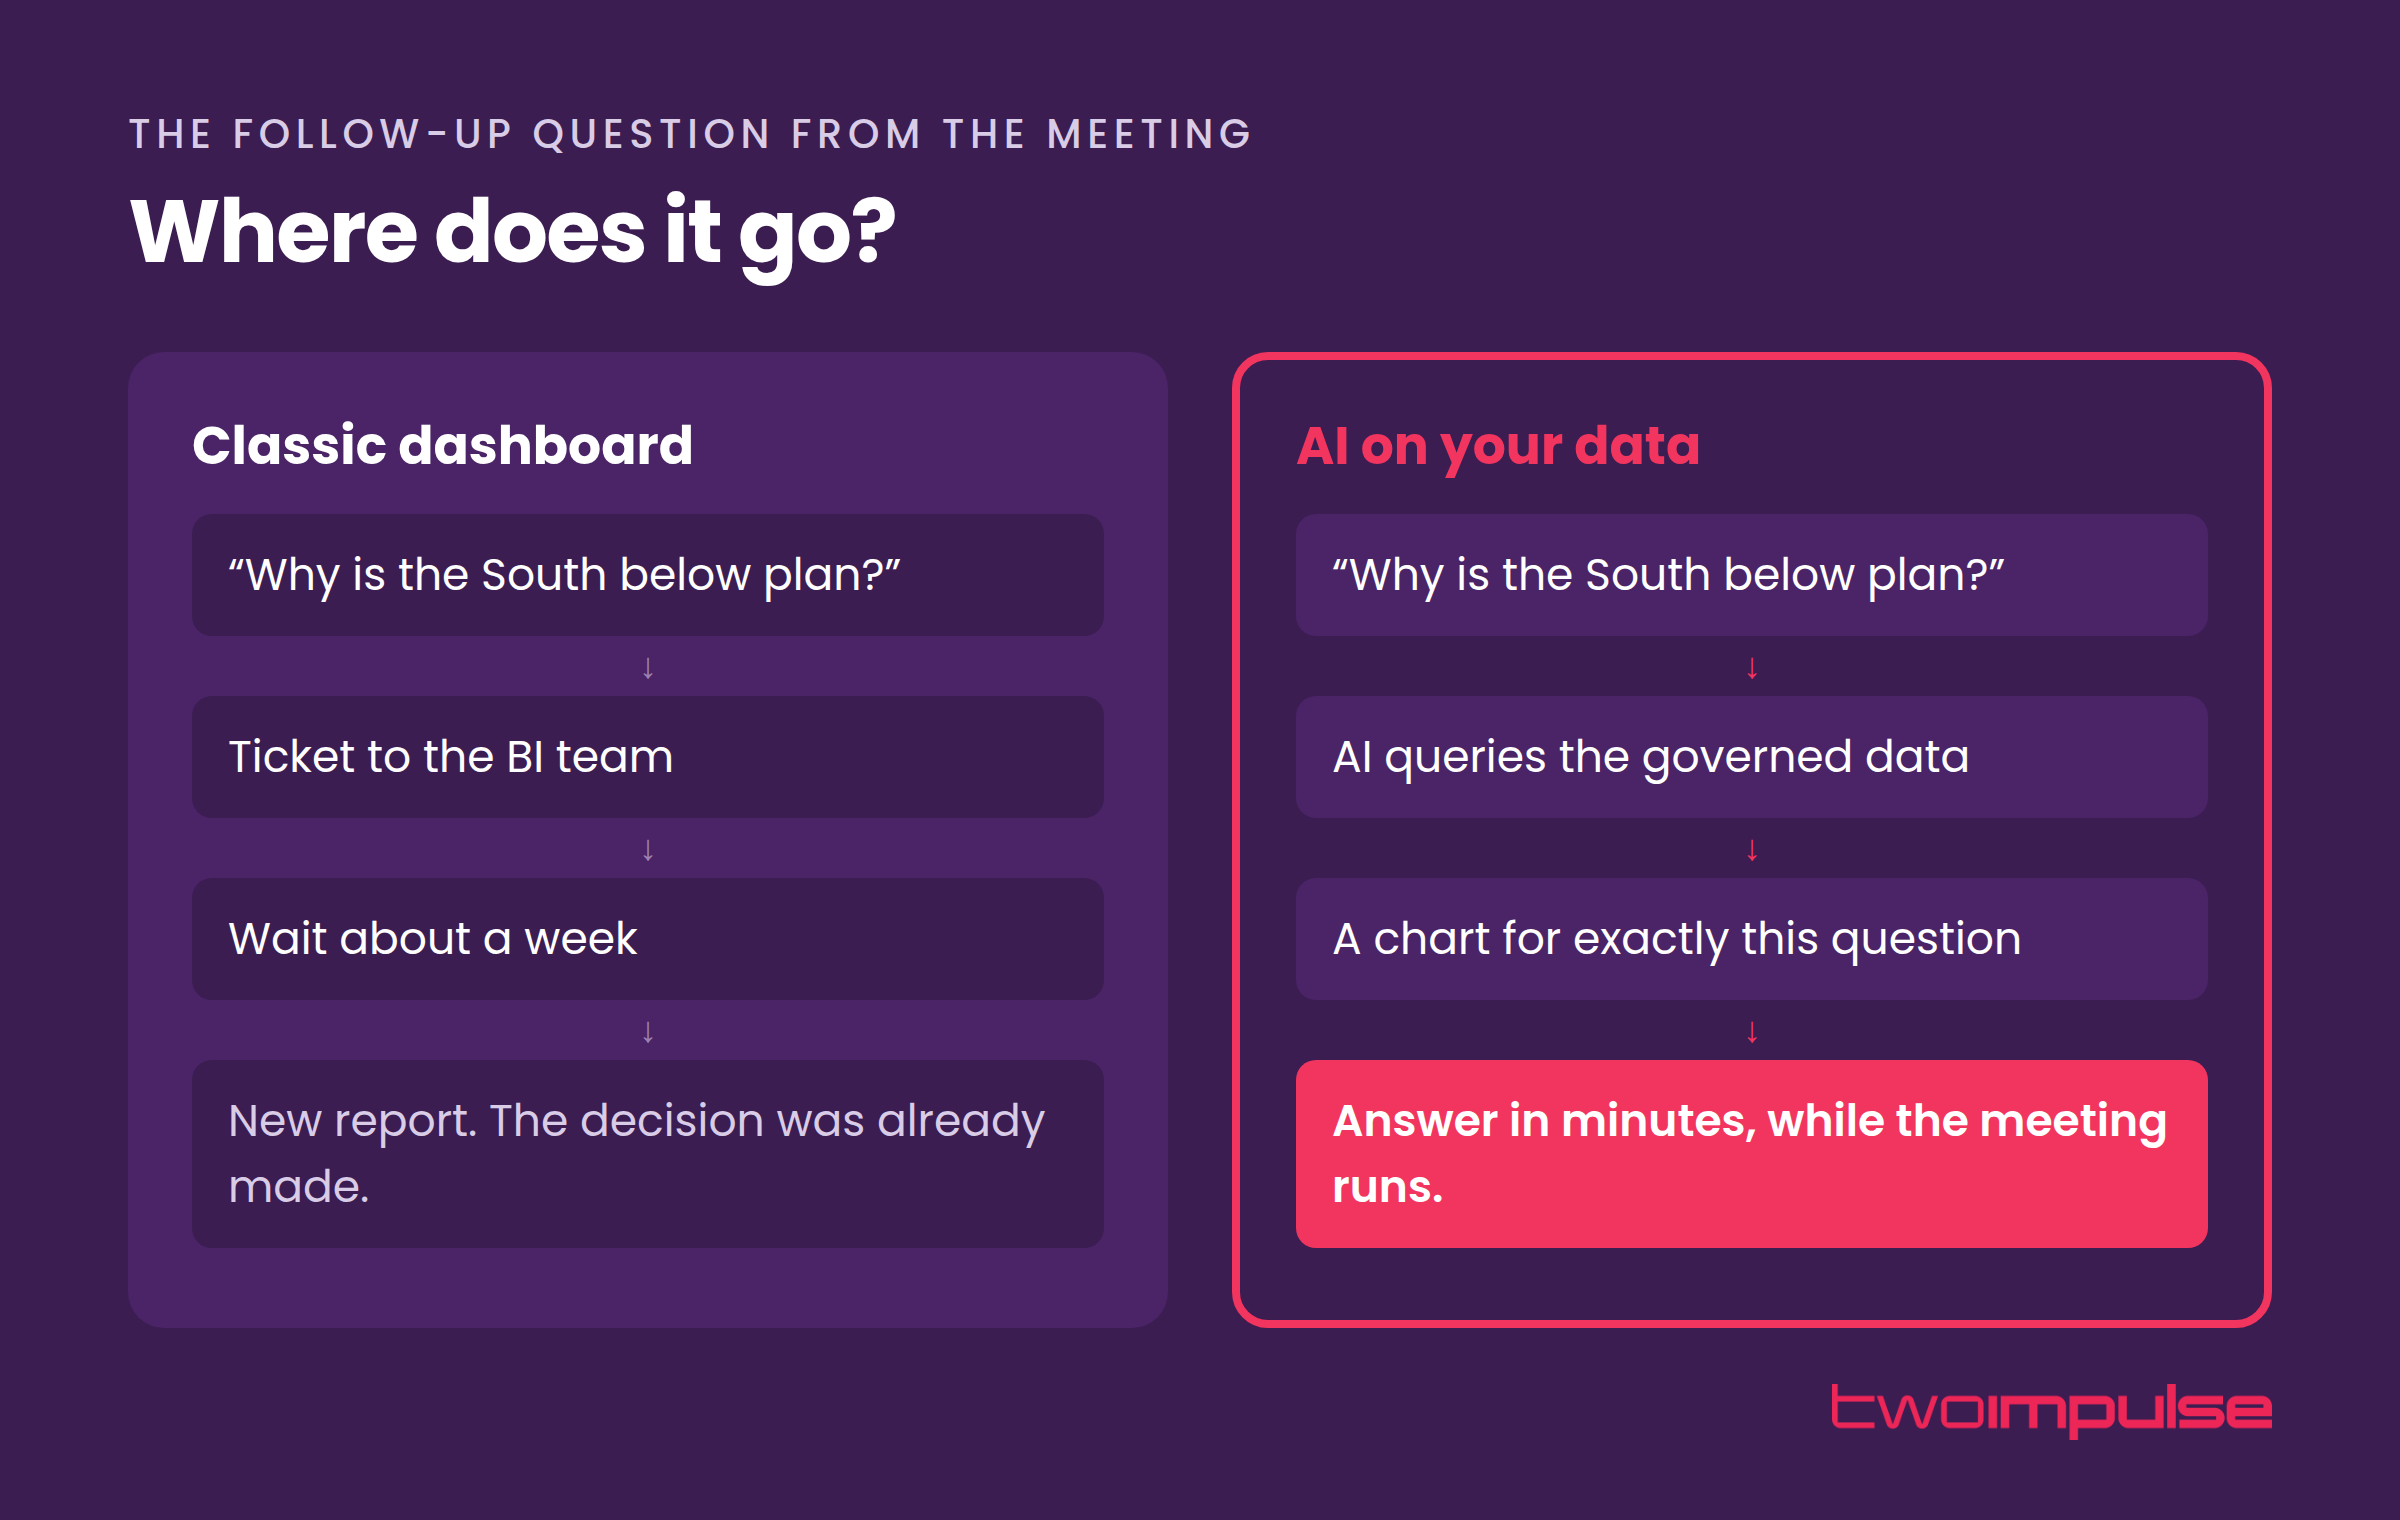
AI changes the format. With an AI connected to the analytics database, you ask the question in plain language and get the table or chart for exactly that question, built on the spot. If the next question goes one level deeper, the view changes with it. When you are done, nothing needs to be maintained.
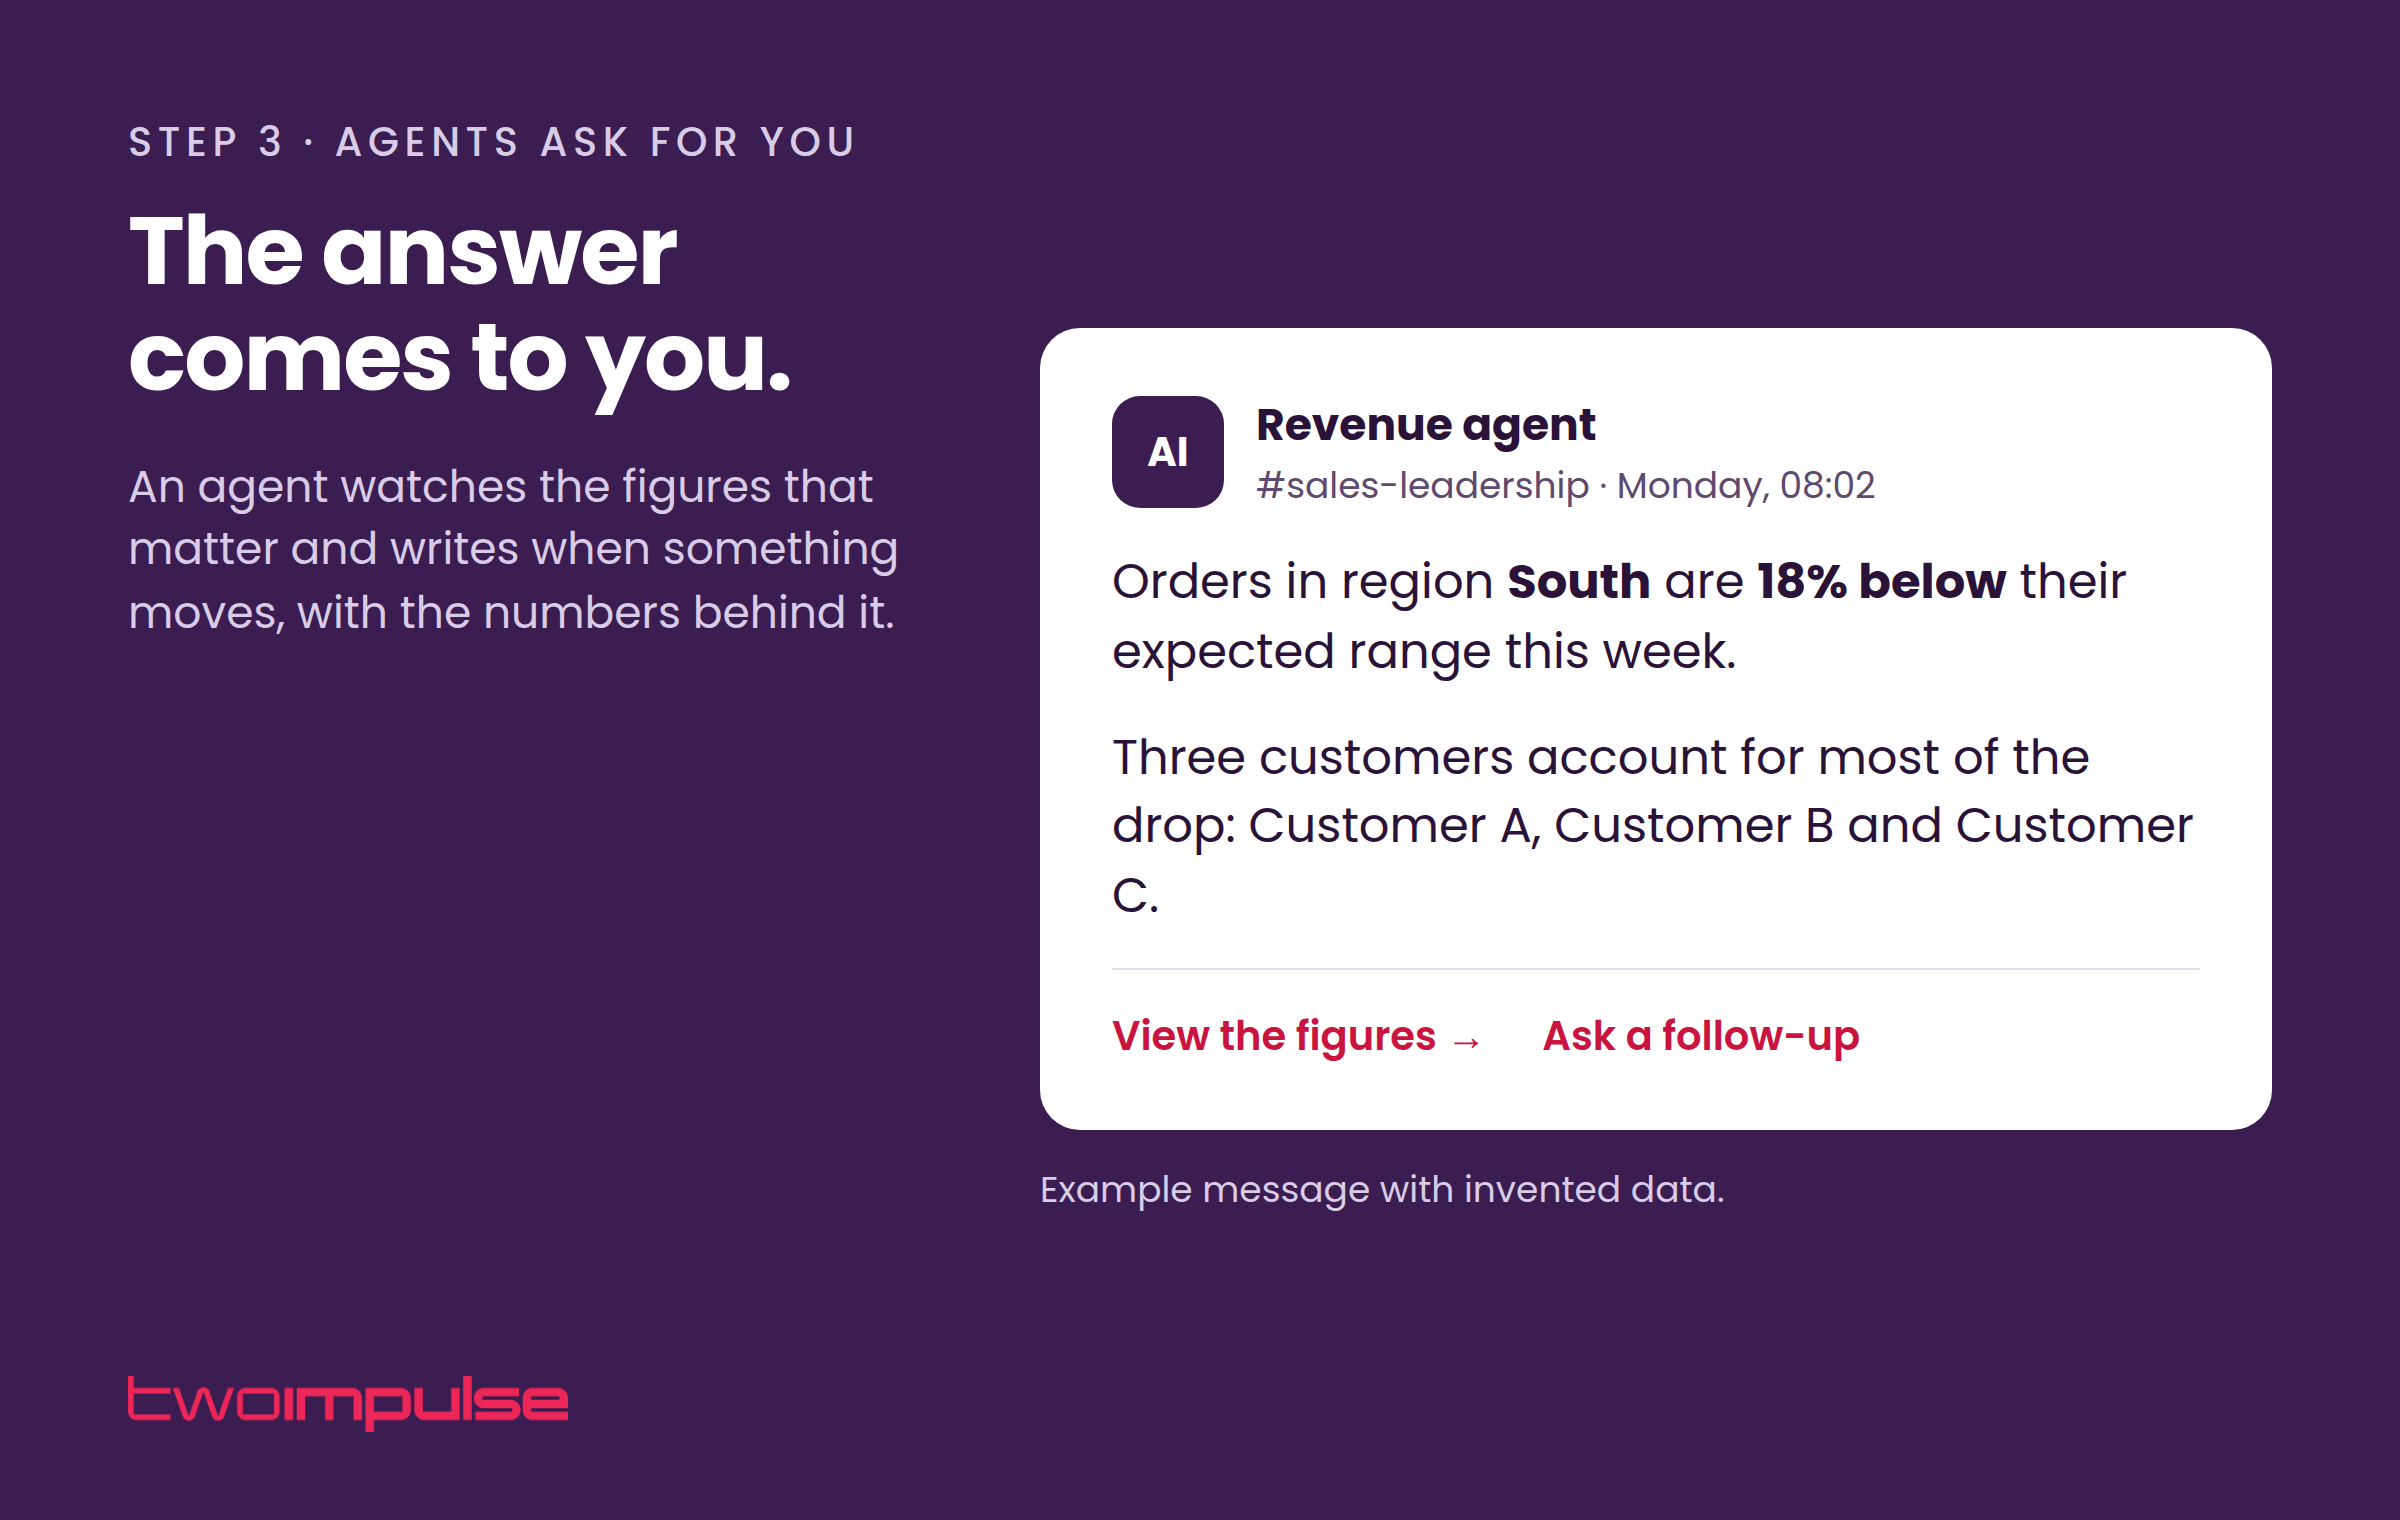
An AI agent goes one step further and does the asking for you. It watches the figures that matter to you and sends a short note to your inbox or team chat when something moves. When orders in a region fall outside their expected range, you hear about it that morning, together with the customers behind the drop, before anyone has opened a dashboard.
A small set of fixed views will stay: the board KPIs everyone has agreed on, and the figures regulators expect in a set format. They become the reference point. The questions get answered elsewhere.
Why a chat on your data warehouse fails on its own
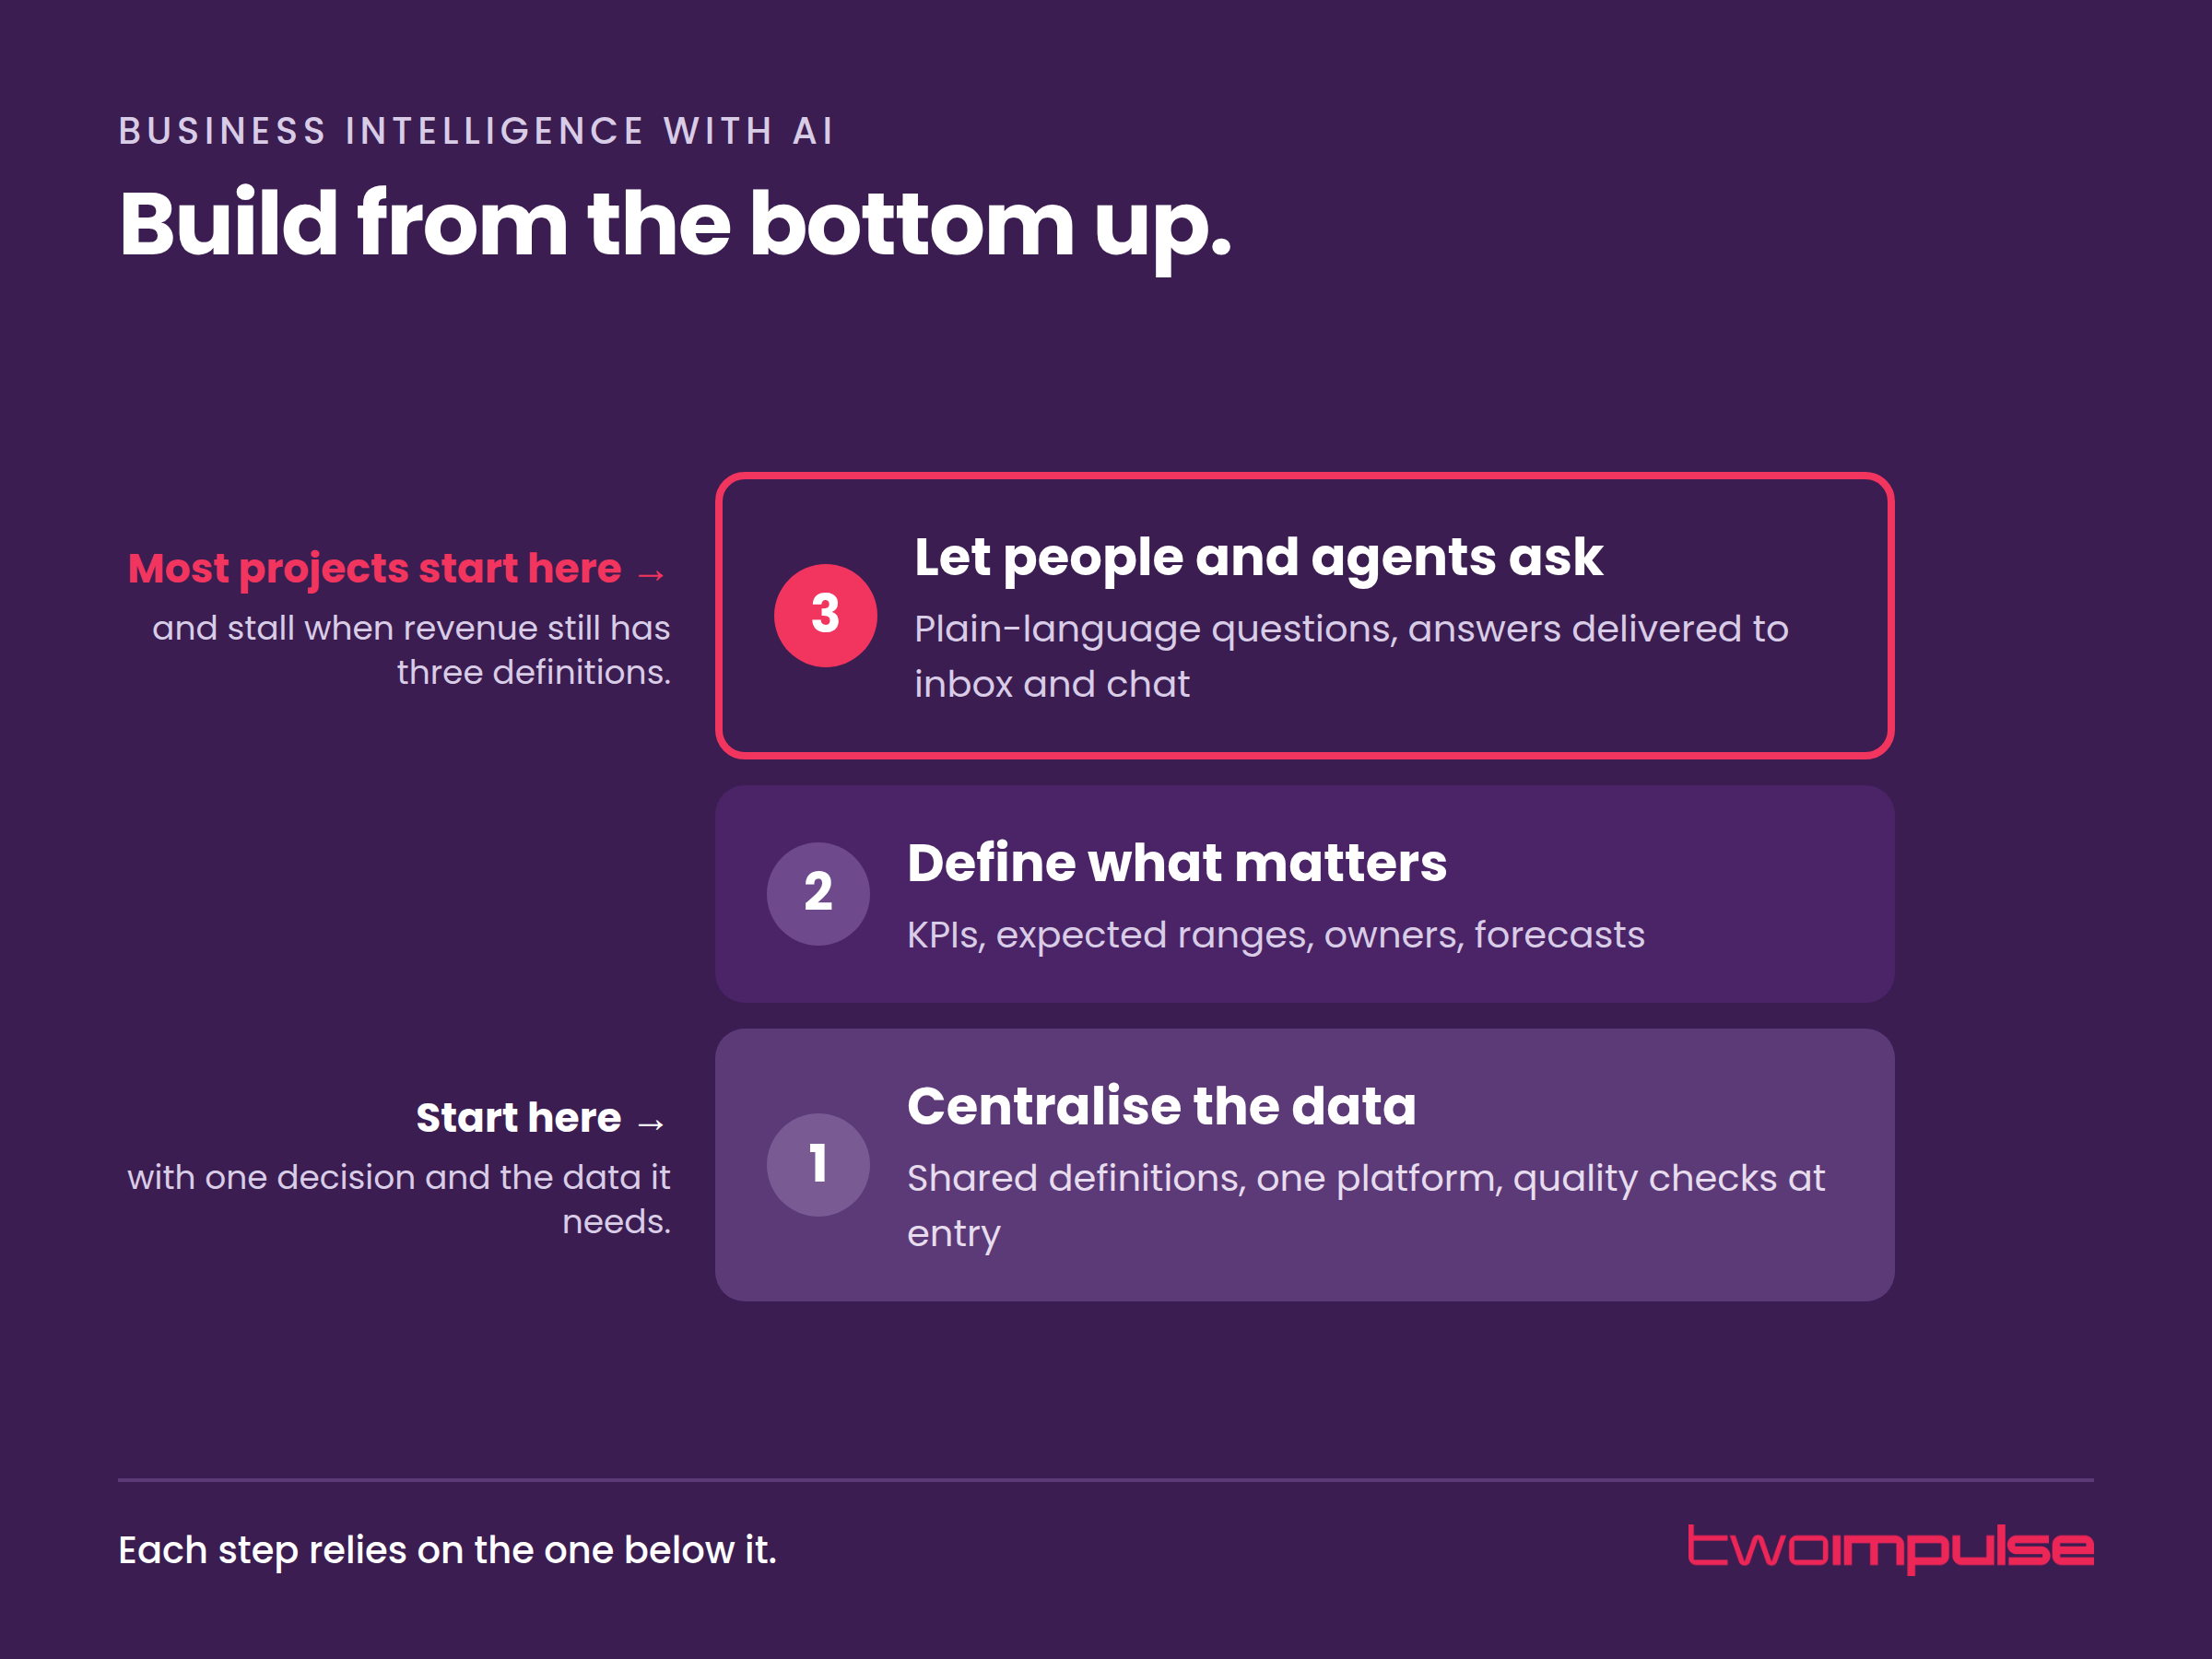
The obvious next move is to put a chat interface on the data warehouse tomorrow. The demo will look convincing. A few weeks later the chat gives a revenue figure that differs from the controlling report, and people go back to their spreadsheets. The usual cause sits in the data underneath, where revenue still has three definitions.
An AI answers only as well as the data it can reach. We therefore work through three steps in a fixed order: centralise the data, define what matters, then let people and agents ask. Each step relies on the one before it.
Step 1: Centralise the data
A single source of truth sounds like a technology project. Most of the work is agreement. Sales, finance and operations each have a working definition of a customer, an order or a region, and each definition made sense when it was set up. Before any data moves, someone has to decide which definition the company reports on and who owns it.
The technical part brings ERP, CRM, core systems and HR data into one modern data platform, whether that is a data lake, a warehouse or real-time streaming. Automated pipelines replace the monthly exports. Data quality is checked where data enters the platform, so an error shows up on the day it happens.
That platform does not always need a separate analytics database. For years, the standard set-up was two systems: an operational database that runs the business, and a warehouse that receives a copy every night, because heavy analytical queries would slow the operational system down. That copy is also why the dashboard from the opening meeting shows yesterday at best.
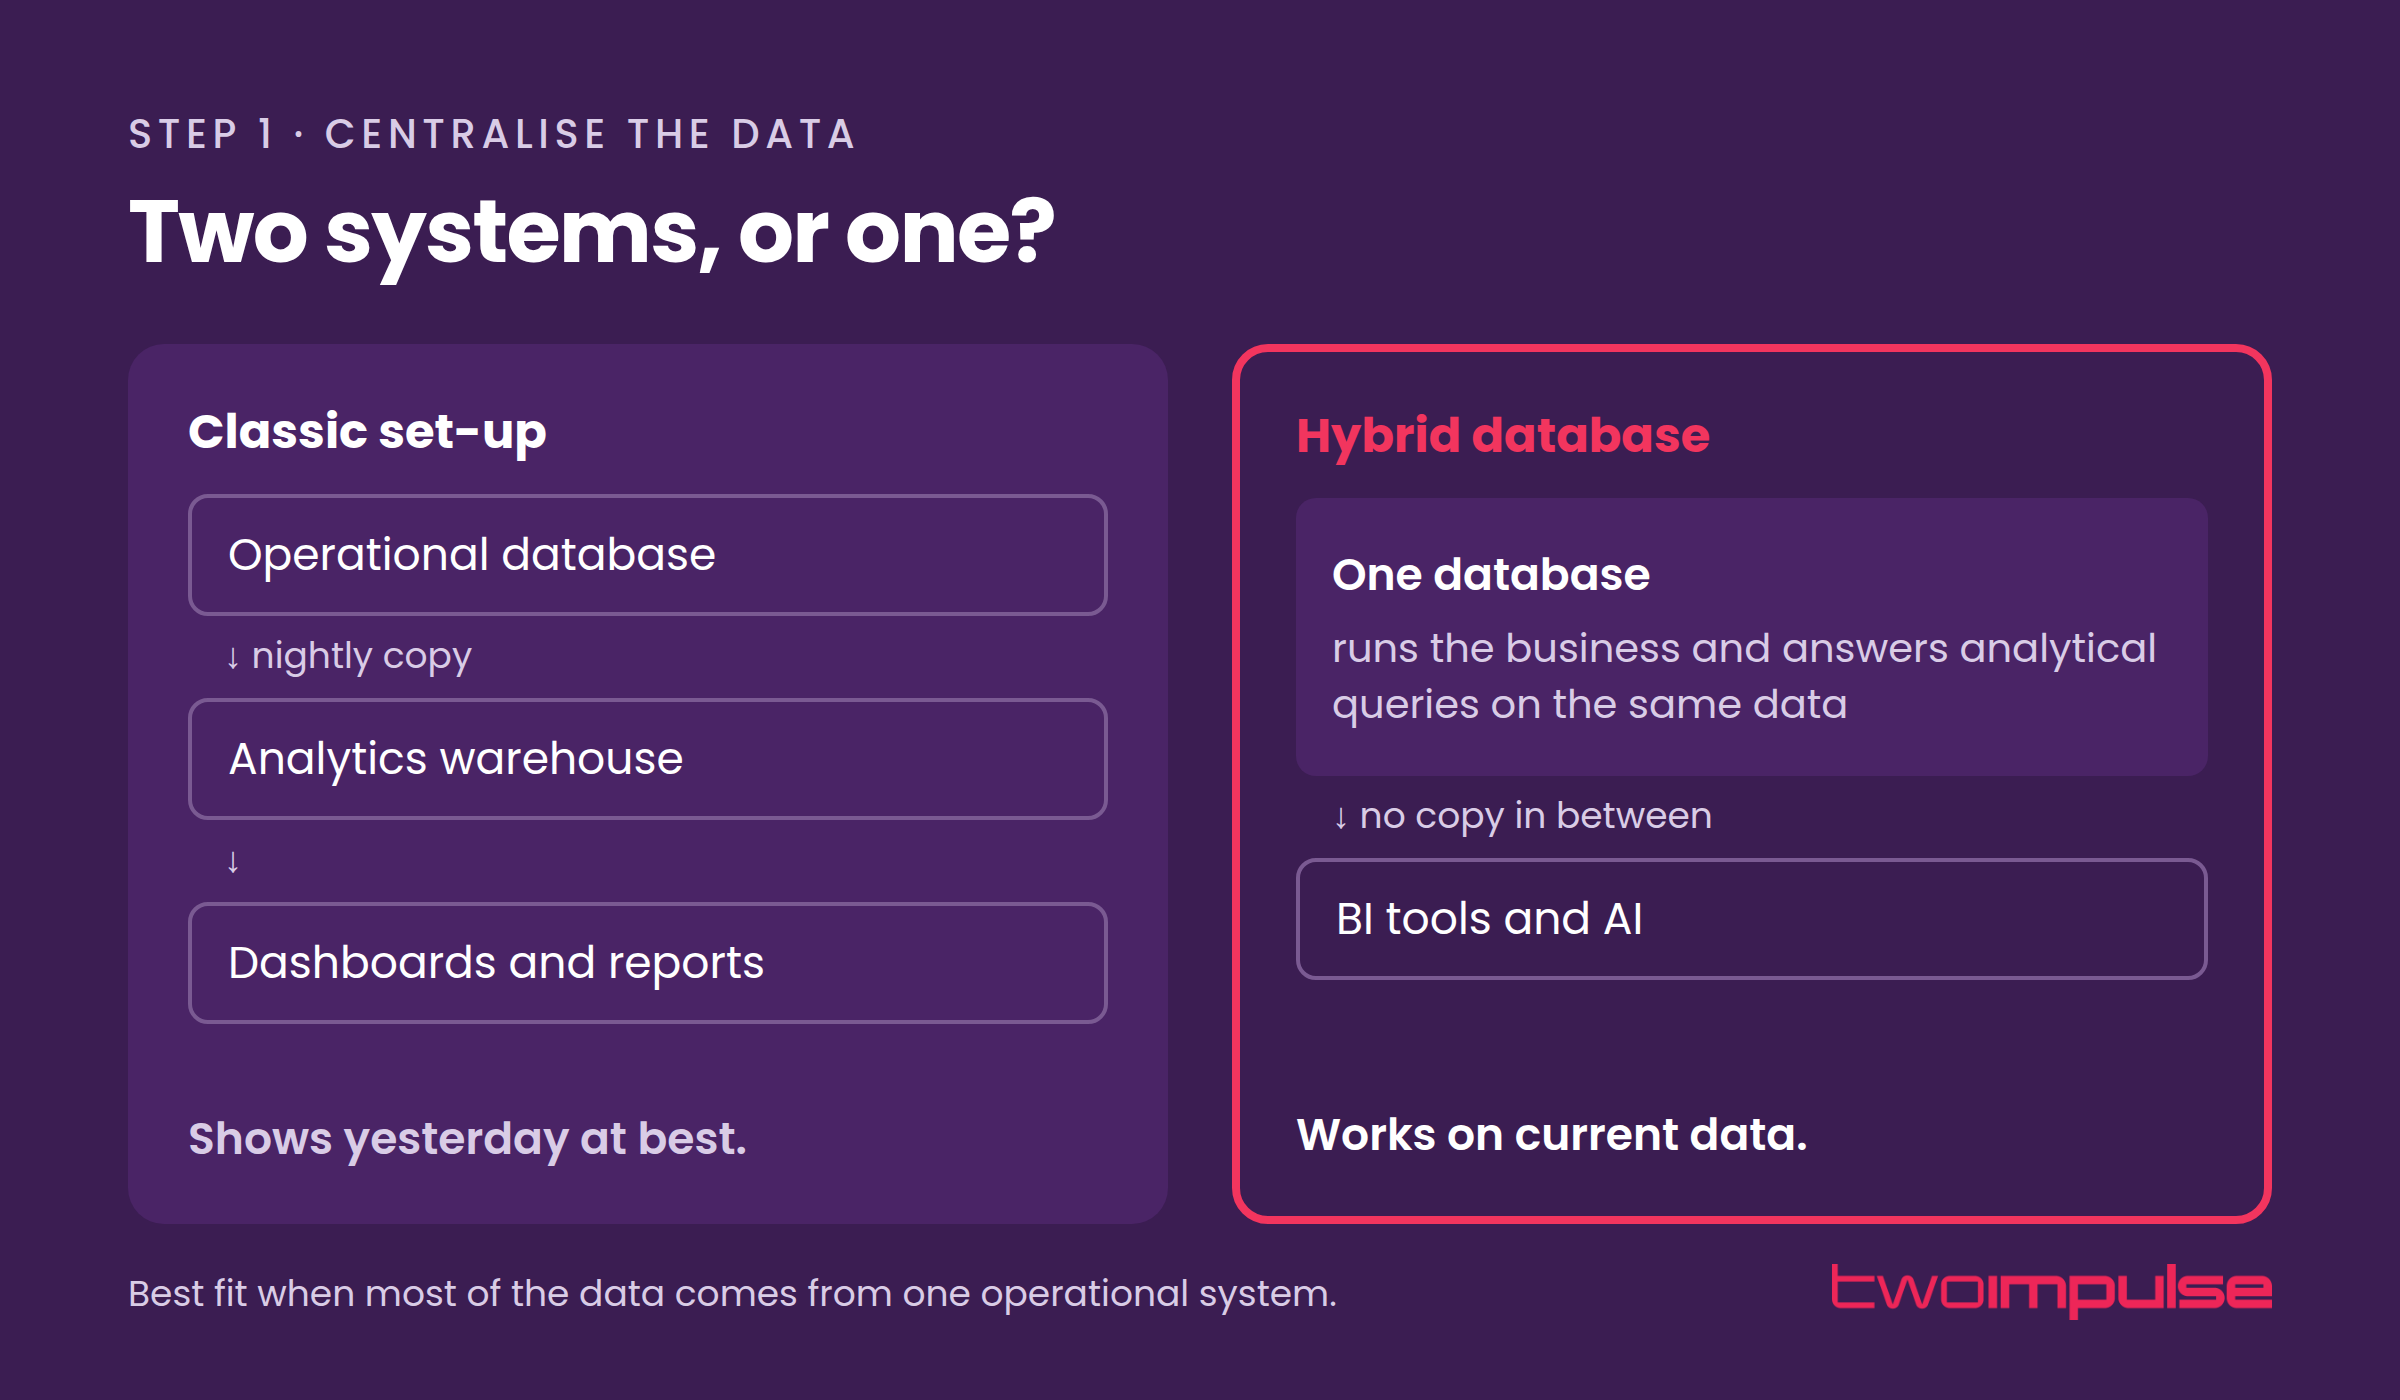
Newer hybrid databases handle both workloads on the same data. CedarDB, a Munich company that grew out of database research at the Technical University of Munich, is one example. It is compatible with PostgreSQL, so BI tools such as Tableau, Grafana or dbt connect to it as they would to Postgres, and there is a free Community Edition alongside on-premise and managed cloud versions.
If most of the data behind a decision comes from one operational system, a database like this can answer analytical questions directly on current data. You skip the separate warehouse, the nightly pipelines that feed it and the delay they create. When a decision draws on several systems, you still have to bring them together, and the work on shared definitions described above still applies.
In practice, a working foundation has these elements:
- an owner for each core definition, such as customer, order and region
- automated pipelines from each source system
- quality checks at the point of entry, with failures visible to the data owner
- access rights that follow existing roles and permissions
- a record of where every figure comes from, so results stay audit-ready
Start narrow. Pick one decision you want to make faster, list the data it needs and centralise that first. Later use cases reuse the definitions you have already agreed, so the platform grows one decision at a time.
Step 2: Define what matters
In the dashboard world, this step meant designing charts. With AI, it means telling the system what matters: the KPIs, how each one is calculated, its expected range and who needs to know when it moves.
With clean, current data in one place, the system can then do more than total up last month. It can show trends as they form, forecast the next quarter from current orders and notice when a KPI leaves its expected range. Predictive models estimate what is likely to happen. Prescriptive models suggest what to do about it, for example which customers to call first or where to shift budget.
Keep it tied to decisions. Each KPI should have an owner and a decision it supports. A KPI nobody acts on is the new version of the dashboard nobody opens.
Step 3: Let people and agents ask
In the third step people ask questions in plain language, for example “Which customers in the south reduced their orders this quarter, and by how much?” A language model translates the question into queries against the governed data model, runs them and returns the answer with the figures behind it, as a table or chart where that helps. A question that used to wait a week in the BI queue can be answered in minutes.
AI agents use the same foundation for the questions nobody has asked yet. One agent sends the CFO a short weekly summary by email. Another posts in the sales team’s chat when a key account’s orders drop. Each message links to the figures behind it, so the reader can go one step deeper by asking a follow-up.
People will only rely on these answers when a few conditions hold:
- The AI answers only from the governed data model, using the definitions agreed in step one.
- Every answer and every agent message shows its sources and the figures it used, so the reader can check it.
- Permissions apply to questions and agent messages in the same way they apply to reports.
- Analysts keep ownership of the definitions and review the results that matter.
The questions are useful data in their own right. A log of what people ask shows where definitions are still unclear and which figures deserve an agent of their own, which feeds straight back into steps one and two.
How ESA applied the same order
The European Space Agency’s European Space Operations Centre (ESOC) runs spacecraft missions, which is a long way from month-end close. The problem has a similar shape, though: many sources, different formats, and people who need an answer while the decision is still open.
During a spacecraft anomaly, operators had to cross-reference live and historical telemetry, dense Flight Operation Procedures and anomaly databases by hand. ESA had already laid the groundwork. Its existing assistant, OCAI 2.0, offered semantic search across 15 institutional sources. The volume of information still forced lengthy manual analysis and pushed up the Mean Time to Resolution. ESA wanted to add AI on top of what already worked.
We built OCAI Next Generation, a multi-agent assistant inside the mission-operations workspace. A coordinator routes each question to specialised agents for telemetry, procedures, the anomaly database and logs. The assistant combines telemetry, Flight Operation Procedures, anomaly databases, logs, JIRA and ARES into one grounded answer, and every response cites the ESA documentation and telemetry it is based on. It runs fully on-premise on open-source models.
The results:
- Telemetry-to-procedure correlation dropped from hours to minutes.
- Every response cites its sources, which reduces the risk of hallucination.
- The assistant is in use across 20 missions at ESOC.
- Adoption and time-to-answer are tracked mission by mission.
For a finance or BI team, the useful part is the order ESA followed. The sources were connected before any agent was added. Answers cite their sources, so operators can check each one against the original document. ESA also measures adoption and time-to-answer per mission, and that is the kind of evidence a CFO will want before opening plain-language questions to more teams.
A quick check for your organisation
- How old is the data in the dashboard your management team looked at last?
- How long does a typical follow-up question take to answer, from request to result?
- How many dashboards did your team build last year, and how many of them did anyone open last month?
If the answers are “a month”, “a week or more” and “not many”, your dashboards describe the business well and help to steer it far less.
Where to start
You do not need a company-wide data programme to begin. Choose one decision that currently waits on the BI queue, such as the monthly forecast review or pricing by region. Centralise the data that decision needs and agree its definitions. Then open plain-language questions to a small group of users and set up one agent that reports the key figure to the people who own the decision. Measure how long answers take before and after, and extend from there.
Our short version: stop reporting, start anticipating.
Learn more about Data & Business Intelligence, read the ESA case study, or book a free consultation.